
Pic-Jour Math: Pictorial Journal Writing in Mathematics to Understand Pi

Come every fall, teachers of mathematics are confronted with oversized classes filled with students who vary in both their learning style and their way of communicating what they have learned. Teachers are challenged to recognize and exploit those differences or risk bored or confused students who lack any true mathematical understanding and may end up manipulating numerical symbols and equations by rote.
Both experience and research in the past twenty years have demonstrated the clear effectiveness of using a multimodal, interactive approach to teaching basic mathematics concepts. Multimodal teaching gives each student the opportunity to focus on his or her own best, innate style of communication and learning.
Most multimodal approaches have emphasized the combined use of numbers, manipulatives, and pictures in teaching students and assessing their level of comprehension. This article will focus on another essential element of multimodal teaching: journal writing. Although writing about mathematics has received relatively less attention than writing in language arts of social studies, this activity can open an important new avenue to the teacher seeking to reach every student effectively.
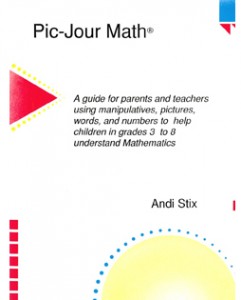 Pic-Jour Math uses journal writing, including pictures, numbers, symbols, and manipulatives, to help students in grades 3 through 8 understand mathematics concepts–and make them truly their own. The results are a better understanding and retention of mathematics, a decrease in “math anxiety,” and a heightened confidence level among students who have really made a lesson “their own” (Stix 1992). At the same time, writing about mathematics offers a flexible assessment tool for teachers and parents to review and analyze students’ thinking, reasoning, and learning styles.
Support for Multimodal Approaches
Historical evidence abounds that people naturally integrate information in many different ways. Despite various approaches over the years to structuring classroom presentations, however, Cuban (1983) contends that teaching in this century has retained a predominantly passive, symbol-oriented mode that relies on a question-and-answer format. Baum (1990) states that most schools still have a distinct tendency to reward only verbal proficiency.
One problem inherent in a lecture-driven, rote form of teaching is the difficulty in assessing students’ actual level of comprehension. As an example, suppose pi is introduced in a typical, lecture-style presentation. Following such a lesson, many students will remember that the circumference of any circle may be obtained by multiplying its diameter by pi. They may remember the formula long enough to recite it on their next test and may even be able to employ pi successfully in later calculations. That most of these youngsters really understand what pi means or could clearly explain the concept to others is highly questionable.
In contrast, the multimodal approach to teaching conveys a deeper and truer understanding of mathematics. Presmeg (1985), Gagne and White (1978), and Clements and Del Campo (1989) agree that a multimodal approach can enable students to link verbal knowledge, visual imagery, and personal experience. Verbalization can be used to move the individual to a deeper level of understanding (Phillips 1987). At the same time, visualizing mathematical ideas, especially during the middle grades, offers students a way to bridge concrete and abstract modes of thinking (Ben-Chaim, Lappan, and Houang 1989).
In practice, a multimodal approach to teaching gives students the opportunity to discover mathematical truths on their own, in their own natural learning style. The difference can be seen by revisiting the lesson on pi, this time using a multimodal approach.
The teacher starts off by asking, not telling, the students if they think the relationship between circumference and diameter should be the same for any circle. Most of the students aren’t sure, so the teacher suggests an experiment in which students are to decorate the edge of a lampshade in their bedroom with a ribbon in the school colors. They need to find out the shade’s circumference to know how much ribbon to use. They know that the diameter of the shade is one decimeter. “Using the diameter alone,” the teacher asks, “can you figure out how much ribbon you need?” The students agree that they can–if the relationship between diameter and circumference really is constant.
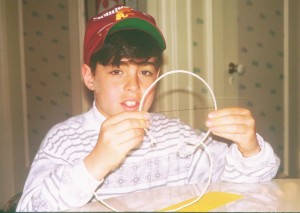
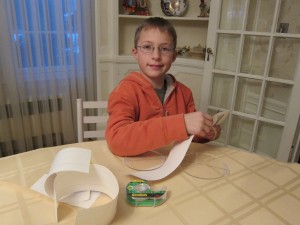
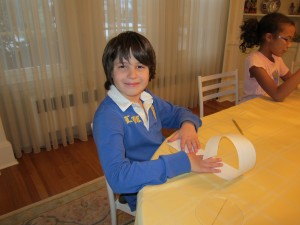
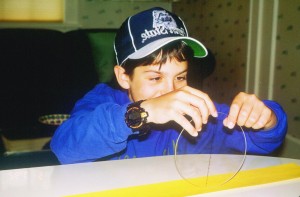
Each student is then handed Picture Pi, a flat, clear acrylic disc manufactured by The Interactive Classroom (1993) (plastic lids from tennis-ball cans or coffee cans could also work well), and asked to measure its diameter and circumference. The diameter is easy to measure with a ruler; the edge of the circle requires more invention. Here is where differences in strategies will start to appear. Some students will use a string to measure the circumference, some will wrap a strip of paper around the edge, and some will rotate the disc along a sheet of paper and measure the line segment created. Again, no one way is “right,” the student is encouraged to use the method with which she or he feels most comfortable.
The teacher then suggests that the students think of the diameter of the disc as being worth a dollar, or 100 cents. Most students agree that the circumference of the disc can fit three whole diameters, worth three dollars, with a small amount leftover. The diameter of the disc, worth 100 cents, is then divided into twenty equal segments. Each will be worth five cents. Measuring this “leftover” amount along the diameter makes it clear that the remainder equals a little less than three of the five-cent sections of the diameter, or 14 cents, or about 14/100. That “measurement” can be read as about $3.14, or simply 3.14–a close approximation of pi.
 “But,” the teacher continues, “will other circles necessarily have the same relationship between their circumference and diameter?” The teacher shows students a smaller disc from the Picture Pi set. Most students guess that the relationship will be smaller than the approximately 3.14 value arrived at earlier, reasoning that as a circle decreases in size, the relationship also should decrease. They decided to test their theory by repeating the process with the smaller disc.
Surprise! The students discover for themselves that pi is a constant regardless of the size of the circle. To figure out how much school ribbon is needed for the lampshade, they realize that they can multiply the diameter (one decimeter) by 3.14, the approximation of pi, to find out that they need 3.14 decimeters of ribbon–plus, the teacher adds with a smile, a bit extra for an overlap of the ribbon.
The student has now solved the pi problem both spatially, using hand-on manipulatives, and numerically. But a student may tend to see manipulatives in isolation, without bridging them to symbolic representations or numbers. This gap is where writing enters the picture.
Next, the teacher asks the students, perhaps as homework, to describe–in writing, pictures, and numbers–the process each of them used to determine pi. Proper grammar and artistic style are not of concern; the very process of explaining and showing how she or he used the discs will enable each student to link his or her manipulative experience to the numbers.
The Journal-Writing Mode
Vacca and Vacca (1966) concluded that the most effective method of using writing to teach mathematics is through a journal, which acts as an essential vehicle to record and assess the verbalization and visualization processes that are simultaneously at work in the learning process. Journal writing also offers an interactive way for students to communicate back what they have learned, so that teaching is not a one-way street. Journal writing encourages students to sort out logically, construct, and make concepts meaningful for themselves. Initially, the writing serves to help students sort the information for themselves; later, they are better able to communicate those ideas to others.
In addition, Selfe, Petersen, and Nahrgang (1986) found that although the initial journal entries may be unfocused, the jottings will progress to more concrete writing as students examine their thoughts and as their perceptions of a solution begin to solidify. Unlike memorization, expressive writing can expose misconceptions that otherwise might go unnoticed and allow students to clarify issues for themselves and the teacher. Evans (1984) found that students remembered and retained information better after the information was discussed in a journal entry.
Research (Stix 1992) with preservice teachers suggests that Pic-Jour Math, “a pictorial journal process” using pictures, words, and numbers, also enhances the student’s ability to define concepts and to present a clear, logical solution to a given task. With more modes of expression available, students have more evidence to prove their points. Additionally, students who were exposed to a multimodal approach that included journal writing reported that their mathematics anxiety decreased (Stix 1992).
Alternative Assessment for Portfolio Evaluation
Informally reviewing the class’s journal writing is an excellent way for teachers to assess students’ acquisition of a particular concept. Formal evaluation of a section of the students’ journals every week or two, or after a particular unit, can also substitute for a traditional test if a proper assessment technique is used.
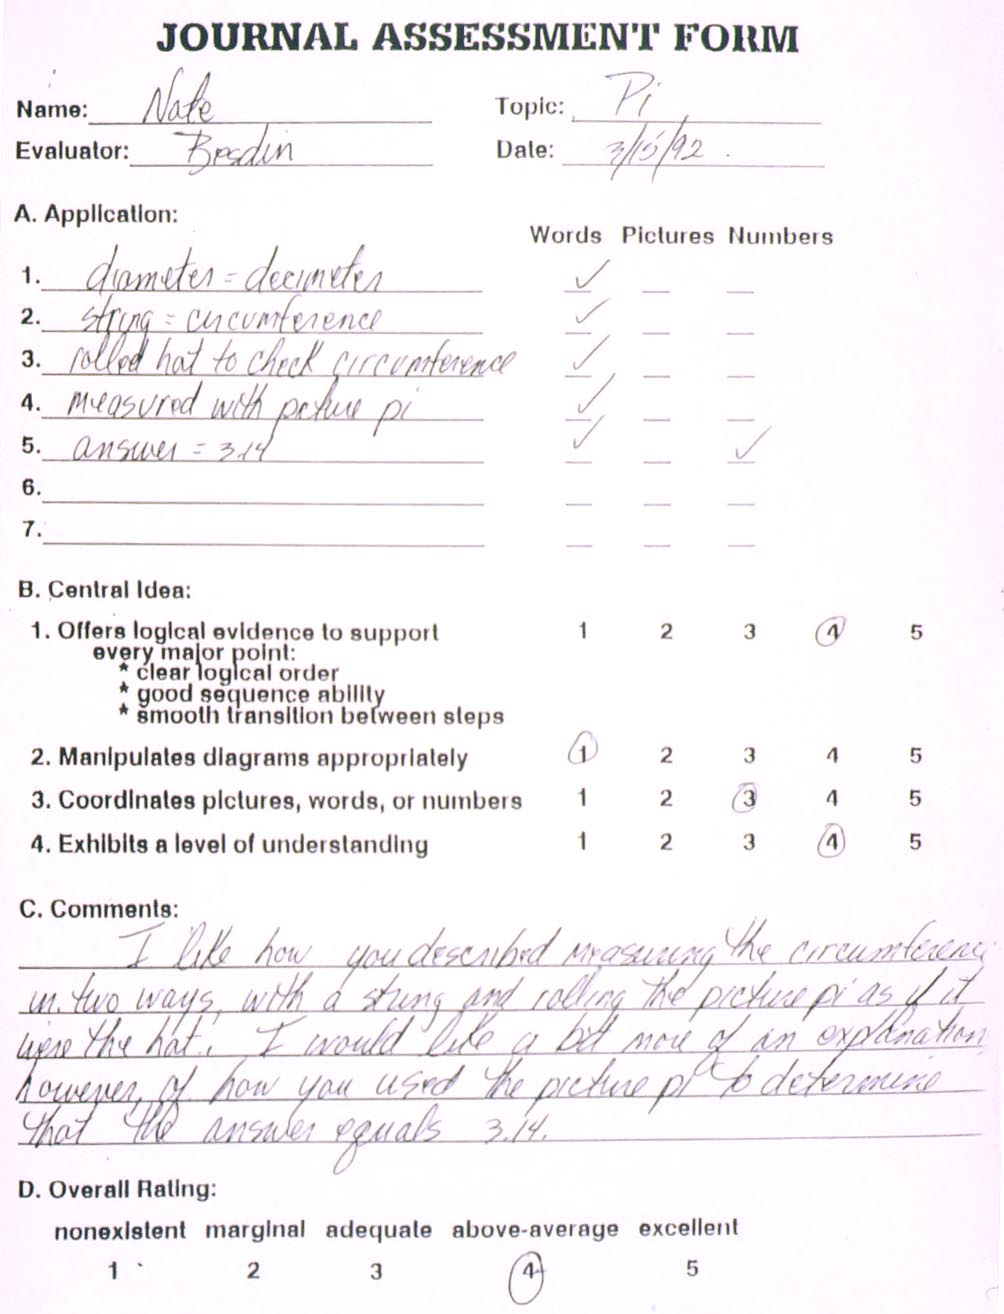
A suggested format for evaluating students’ journals (fig. 1) begins with an assessment of a student’s flow of thought: how often he or she employed words, pictures, and numbers at each step of his or her discovery process. This procedure clarifies which mode or combination of modes the student favors.
Next, using a scale of 1 through 5 (for ratings of nonexistent, marginal, adequate, above average, and excellent), the teacher rates the student’s handling of the central ideas of the lesson: first, whether the student offers logical evidence to support his or her major points; second, whether he or she manipulates diagrams appropriately, using good spatial sense; third, how he or she coordinates pictures, words, or numbers for each step; and fourth, whether she or he exhibits an overall level of understanding. Sometimes the student has an immediate sense of the task. At other times, the process itself becomes a catalyst and the understanding crystallizes at the end.
The evaluation form also includes a section for comments, including positive feedback to the student, points of suggestion, and a final overall rating of his or her understanding of the lesson. The evaluation form thereby furnishes a written record of the student’s work and an assessment of his or her level of understanding as perceived by the teacher, the parent, and the student himself or herself.
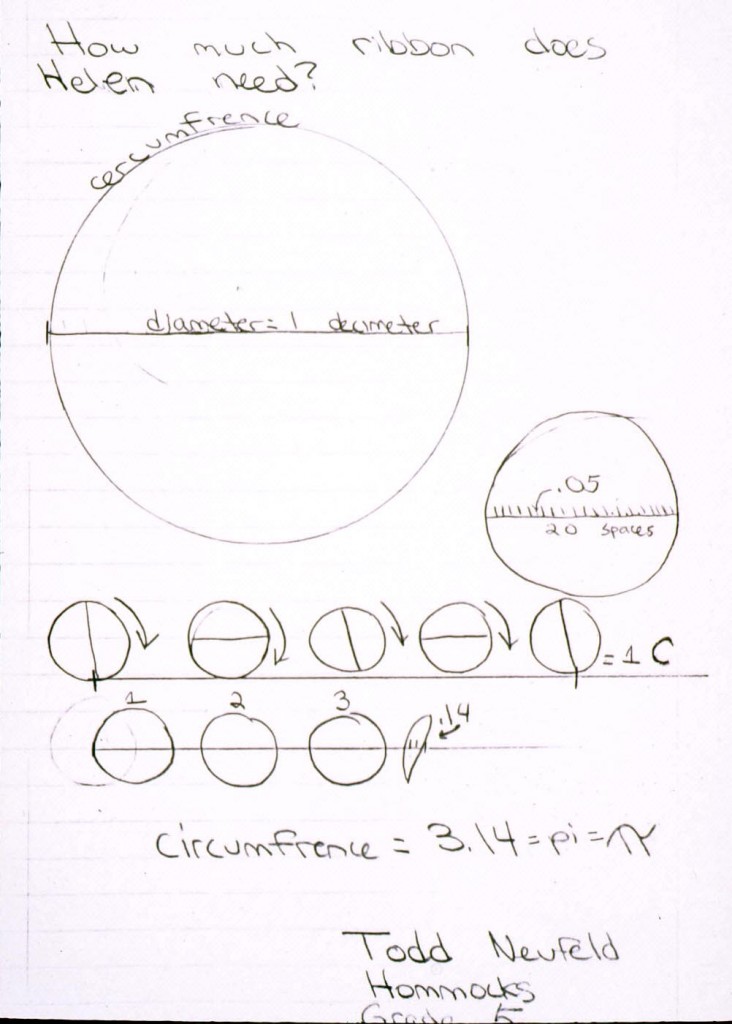
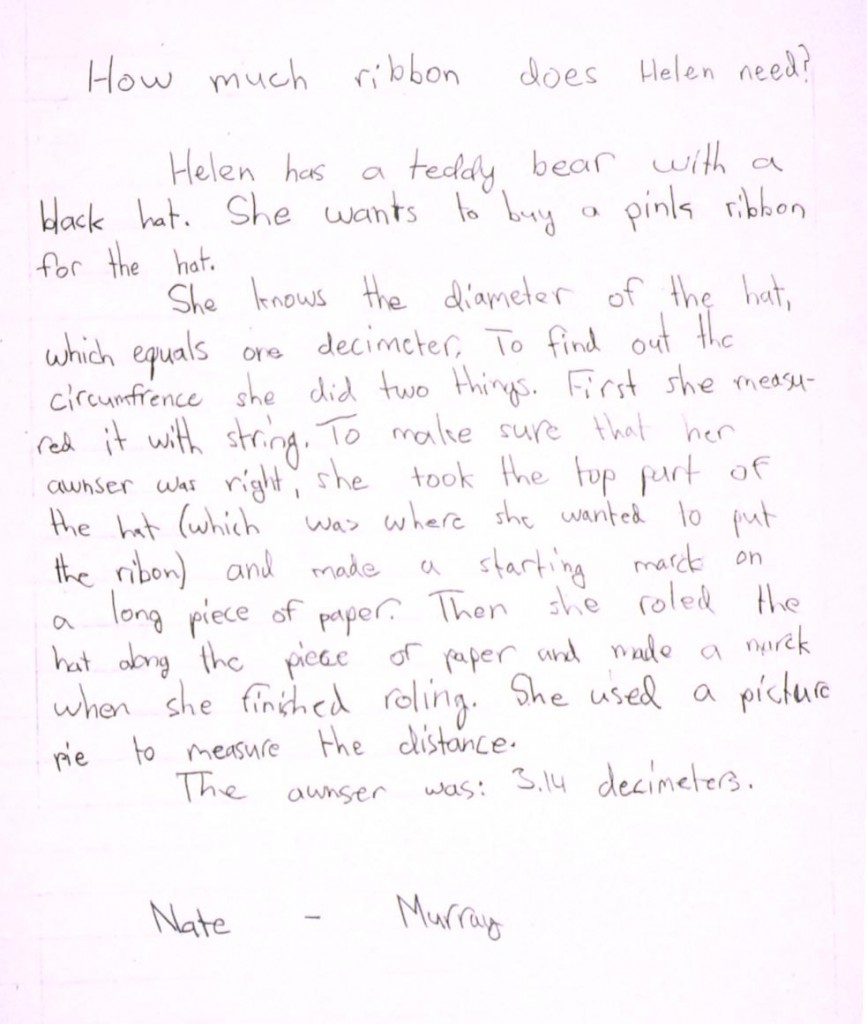
Student journal entries from an actual multimodal lesson in pi (fig. 2 and 3) demonstrate that students vary tremendously in the way they choose to recount a lesson, depending on what mode they prefer. In figure 2a, as his teacher notes in the assessment form (fig. 2b), the student relies almost exclusively upon — and very effectively on — pictures and numbers to express himself, using words only as labels. In contrast, the student who made the journal entry in figure 3a is extremely verbal. Significantly, both students received high ratings from their teachers — 4+ and 5-, respectively — for coordinating pictures, words, or numbers. They were not penalized for preferring to use one mode over another because both students expressed themselves effectively. Other examples of students’ work are included in figures 4 and 5 to show the diversity of responses and thus the diversity of evaluation.
Conclusion
Teachers need to respect that students come to the classroom with eclectic processes for integrating information. Furthermore, they need to acknowledge the evidence that children have distinct modes of self-expression. A multimodal approach to instruction and assessment appears to be a logical alternative to current instructional strategies. Moreover, an integrated approach, including pictorial journal writing or note-taking, takes advantage of students’ strengths, deepens their understanding, and teaches them to communicate their ideas to others effectively.
Anxiety and enthusiasm are equally contagious. If teachers gain confidence in better identifying and nurturing potential talent through the recognition of differences in learning, we may see an increase in the percent of students who go on to major in mathematics at the college level. At the least, youngsters will become active participants in their own learning, problem solvers who discover that fun, interest, and even excitement are to be found in learning mathematics.
by Andi Stix, Ed.D.
© 1994 The Arithmetic Teacher, vol. 41, no. 5, January
![]()
By examining students’ journals, in what ways do you note the differences in the ways in which they process information? For what reasons is it critical for classroom instruction to be differentiated to meet the needs of all learners?
—————————————
Andi Stix is an educational consultant & coach who specializes in differentiation, interactive learning, writing across the curriculum, classroom coaching, and gifted education. For further information on her specialties or social media, please email her on the Contact page.
References
Baum, S. (1990). Gifted but learning disabled: A puzzling paradox. Reston, VA: The Council for Exceptional Children. (ERIC Document Reproduction Service No. ED 479 90)
Ben-Chaim, D., Lappan, G., & Houang, R. T. (1989). The role of visualization in the middle school mathematics curriculum. Focus on Learning Problems in Mathematics, 11, 49-60.
Clements, M. A., & Del Campo, G. D. (1989). Linking verbal knowledge, visual images, and episodes for mathematical learning. Focus on Learning Problems in Mathematics, 11, 25-33.
Cuban, L. (1983). How did teachers teach, 1890-1980. Theory into Practice, 22, 159-165.
Evans, C. S. (1984). Writing to Learn in Math. Language Arts, 61, 828-835.
Gagne, R.M., & White, R.T. (1978). Memory Structures and learning outcomes. Review of Educational Research, 48, 187-222.
Phillips, E. (1987). Algebra. In V. Pedwaydon (Ed.) Proceedings of the honors teacher’s workshop of middle-grade mathematics (ERIC Document Reproduction Service No. ED 295 792).
Presmeg, N.C. (1985). The role of visually mediated processes in high school mathematics: A classroom investigation. Unpublished doctoral dissertation, University of Cambridge, Cambridge, England.
Selfe, C. L., Petersen, B. T., & Nahrgang, C. L. (1986). Journal writing in mathematics. In Art Young & Toby Fulwiler (Ed.), Writing across the disciplines: Research into practice. Montclair, NJ: Boyton/Cooks.
Stix, Andi N. (1992) The Development and Field Testing of a Multi-Modal Method for Teaching Mathematical Concepts to Preservice Teachers by Utilizing Pictorial Journal Writing. Ph.D. diss. Columbia University Teachers College. Ann Arbor, Mich: U.M.I. Dissertation Information Service, Pub. #92-18719.
Vacca, R.T., & Vacca, J. (1986). Content area reading. Boston, MA: Little, Brown, and Co.